Book Biometrics: 7 Vital Metrics for Indie Authors (2026)

A data-driven framework for self-published authors. The seven leading indicators that predict whether your book is gaining, holding, or losing ground, plus how
What book biometrics actually means
Book biometrics borrows from medicine. A doctor measures pulse, blood pressure, oxygen, and temperature to assess whether a patient is healthy. For your book, the equivalents are sales velocity, BSR, review pace, and a handful of other vital signs that together tell you whether the title is gaining, holding, or losing ground.
This framework matters because most self-published authors check exactly one number: monthly royalty deposits. By the time that number drops, the underlying problem started six weeks ago. Tracking leading indicators flips the timeline. You see the warning signal first, then act, then watch royalties stabilize.
The seven vitals in this guide are the metrics that actually predict revenue. Not vanity counters like Twitter followers or newsletter open rates in isolation. They work as a system: each one explains a different part of the same revenue story, and reading them together is what separates authors who scale from authors who plateau.
Metric 1: Sales velocity (your book's pulse)
Sales velocity is units sold per day, averaged across a rolling seven-day window. It is the single most predictive metric for everything downstream: BSR, also-bought placement, algorithm recommendations, and Amazon''s review-to-purchase ratio. A book selling five copies a day for 30 days behaves nothing like a book selling 150 copies in one launch day, then zero for 29 days.
- Seven-day rolling average daily units across every retailer (Amazon, Apple Books, Kobo, Google Play, direct sales)
- Thirty-day trend versus the prior thirty days, expressed as percentage change
- Spikes that correlate with marketing pushes, BookBub features, or category promotions
- Drop-offs that happen with no obvious external cause (your most useful early warning)
Why velocity beats total sales: Amazon''s algorithm rewards consistency. The A9 ranking system weights recent sales (the last 24 to 48 hours) more heavily than historical sales when ranking books in category. Five copies a day for a year ranks higher than 1,825 copies in one launch week followed by silence. Healthy looks like a velocity that holds or grows by five to ten percent month over month. Unhealthy looks like a 20 percent drop in a single seven-day window with no seasonal explanation.
Metric 2: Page reads and read-through rate (oxygen)
For authors enrolled in Kindle Unlimited, KENP page reads are oxygen. Written Word Media reports that page reads generate roughly half of indie author income on Amazon, and read-through is a sharper signal of reader satisfaction than purchases. A reader who buys your book might never open it. A reader who reads 100 percent of pages is telling you the book delivered.
- Daily KENP page reads as a seven-day rolling average
- Read-through rate per book (pages read divided by KENP eligible pages, expressed as percentage)
- Series read-through (percentage of book 1 readers who buy or borrow book 2)
- Drop-off page number (the page at which the average reader stops, only available with deeper analytics)
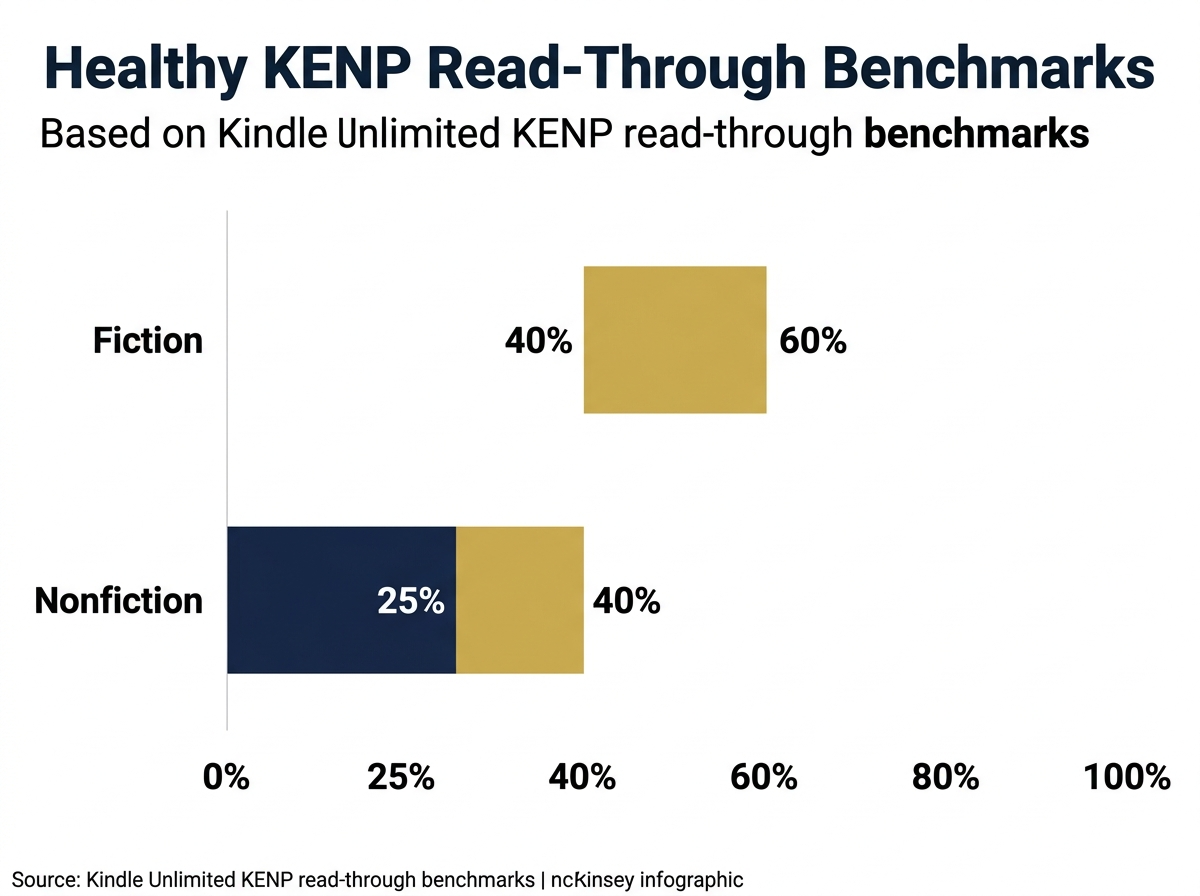
Series read-through is the metric that funds long-term author careers. If 100 readers finish book 1 and 60 buy book 2, your read-through is 60 percent, which is excellent. If only 15 buy book 2, the series has a structural problem (often a weak ending, a confusing arc, or covers that do not signal continuity). Read & Rate''s book biometrics dashboard reports series read-through automatically so authors can spot the drop between book 1 and book 2 before they invest in writing book 4. Healthy benchmarks: 40 to 60 percent read-through in fiction, 25 to 40 percent in nonfiction (where readers often only need the first three chapters).
Metric 3: Best Seller Rank trajectory (blood pressure)
BSR is the most-watched and most-misunderstood number in self-publishing. A snapshot BSR (your book is ranked 47,832 in the Kindle Store right now) tells you almost nothing. The trajectory tells you everything. A book moving from BSR 80,000 to 40,000 to 20,000 over three weeks is a book on the rise. A book sitting at BSR 47,832 because it sold one copy two hours ago is decaying.
Track three BSR views: overall Kindle Store rank, primary category rank, and secondary category rank. The category ranks matter more than overall rank for two reasons: they qualify you for the orange "#1 Best Seller" badge, and they determine which "also-bought" carousels your book appears in. According to Kindlepreneur''s 2025 analysis of A9 signals, books that hold a top 20 category rank for 30 consecutive days see a 3 to 5x lift in organic impressions versus books that spike to top 20 for one day and fall back.
The trajectory metric that matters most: 14-day moving average of overall BSR. If the average is shrinking (lower number means better rank), your book is gaining momentum. If it is climbing, the book is losing visibility, and you have a two-week window to act before the algorithm de-prioritizes the title.
Metric 4: Review velocity and sentiment (heart rate)
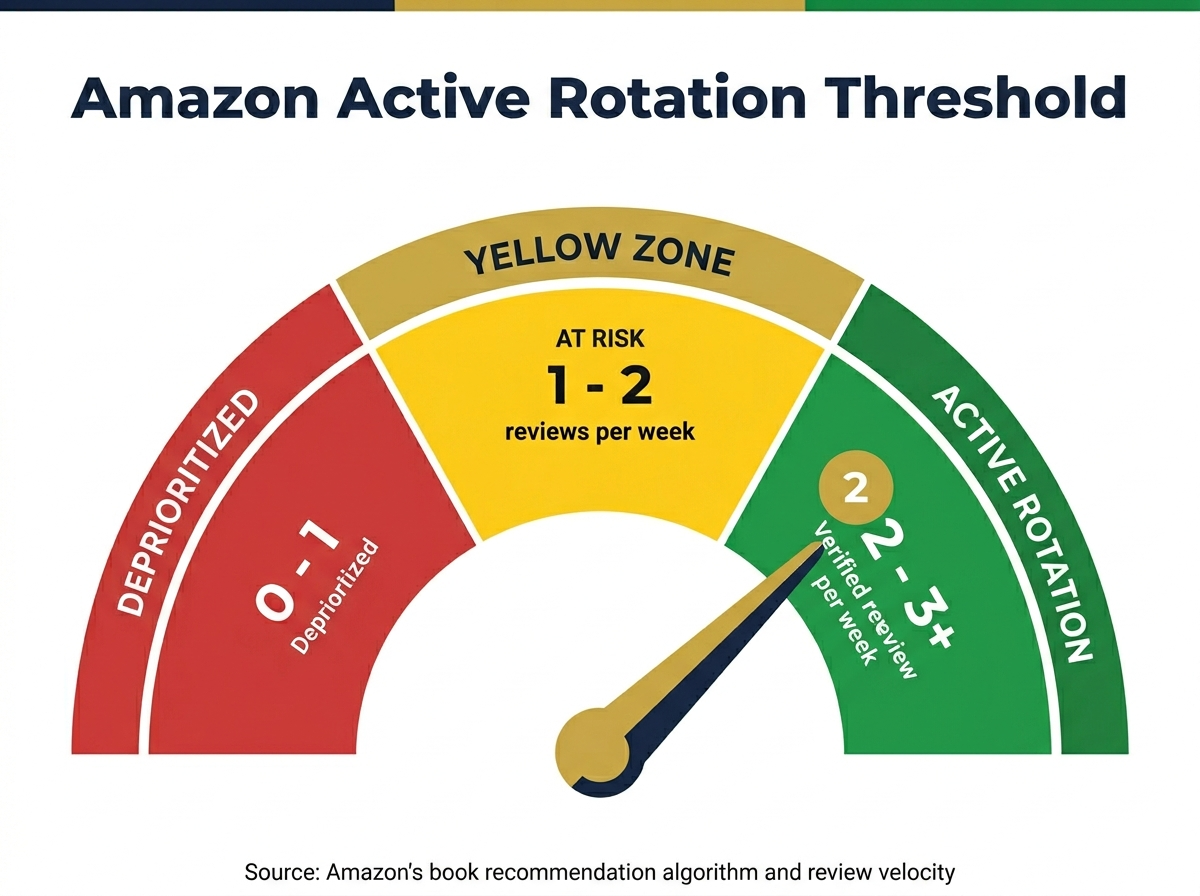
Review velocity is the number of new verified reviews per week, not the total review count. Total reviews are a vanity number; velocity is the heart rate. A book that earned 500 reviews in 2022 but zero in the last 90 days reads as stale to Amazon''s algorithm. A book earning two to three new verified reviews per week stays in the system''s active rotation for category placement and recommendation widgets.
- New reviews per week (rolling four-week average)
- Verified purchase ratio (target above 70 percent, lower triggers Amazon scrutiny)
- Average star rating trend (is the 30-day rolling average rising or falling?)
- One-star and two-star count growth (a single bad review is noise, a pattern is signal)
- Cross-platform review distribution (Amazon, Goodreads, Apple Books, Kobo, Barnes & Noble)
Cross-platform distribution is where most authors leak data. Amazon dominates reviews for a reason, but readers who buy on Apple Books, Kobo, or direct increasingly leave reviews on those platforms only. Reviews on Goodreads, in particular, influence pre-launch buzz for your next book. Read & Rate''s review system was built specifically so authors can collect verified reviews across multiple retailers, not just Amazon, which is how the platform protects authors from the volatility of relying on a single review source.
Metric 5: Keyword and category visibility
Where does your book actually appear when readers search? Amazon allows seven backend keywords plus up to ten browse categories, and most authors set these once at launch and never check again. Keyword rankings drift constantly because competitors enter and exit the same category every week. Tracking your visibility across your top five keywords is how you know whether your metadata still works.
Use Publisher Rocket or Kindlepreneur''s keyword tools to pull a weekly report of where your book ranks for your five most important keywords (the searches you most want to be found for). If you held position 3 on "regency romance enemies to lovers" last month and dropped to 14 this week, you have a metadata or sales velocity problem worth investigating before the slide continues.
- Top five keywords ranked weekly
- Category position (overall, primary, secondary)
- Number of also-bought carousels your book appears in
- Click-through rate from category page to product page (only visible via Amazon Ads dashboard if you run sponsored ads)
Metric 6: Conversion rate (impressions to sales)
Conversion rate ties everything together. It is the percentage of people who see your book and decide to buy or borrow it. If 1,000 readers see your product page and 30 buy, your conversion rate is three percent. The industry baseline for Kindle product pages is 10 to 15 percent for genre fiction (paid), and 5 to 8 percent for nonfiction. Authors who measure this regularly catch cover, description, or pricing problems weeks before sales velocity reveals them.
Two practical conversion ratios to track: impression-to-click rate from Amazon Ads (target above one percent) and click-to-sale rate on the product page (target above ten percent for fiction). If impressions are climbing but clicks are not, your cover or ad creative is failing. If clicks are climbing but sales are not, your product page (description, sample, price) is failing. The diagnosis tells you exactly which lever to pull.
Metric 7: Royalty efficiency (income per page read)
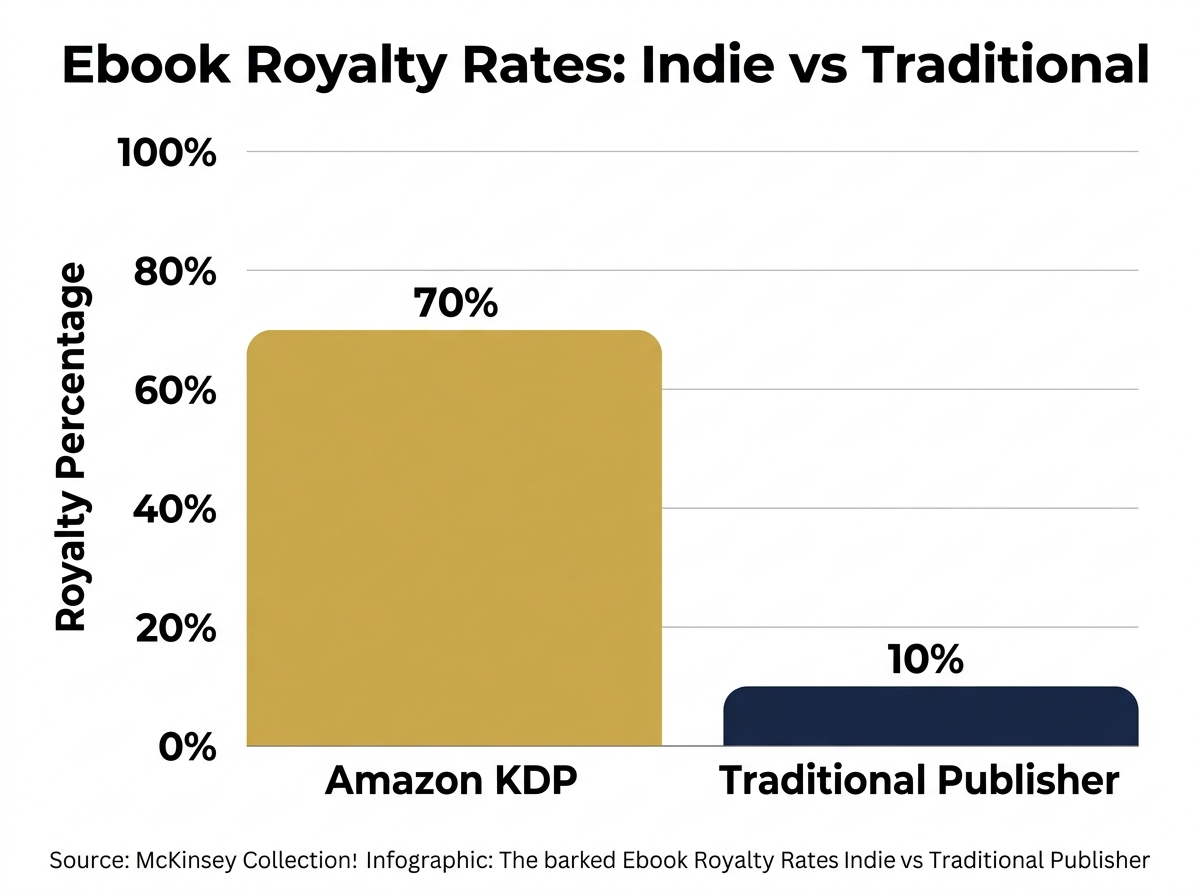
Royalty efficiency is the metric most authors never calculate. It is your total monthly royalty divided by total pages read (or units sold). On Amazon, the KENP per-page rate has historically ranged between $0.0040 and $0.0050 (per Written Word Media''s 2024 industry data), and your effective royalty per book varies based on your price point and the 70 percent versus 35 percent royalty bracket.
Why this matters: two books in the same genre can have identical sales velocity but radically different royalty efficiency. A 90,000-word fantasy priced at $4.99 in the 70 percent bracket earns roughly $3.49 per sale. The same fantasy priced at $2.99 earns roughly $2.05 per sale. A KU borrow on the longer book might earn $4 to $5 in page reads if read through. Tracking royalty per book sold and royalty per 1,000 KENP shows you which books and which price points actually carry your business.
- Royalty per unit sold (broken down by retailer and price point)
- Royalty per 1,000 KENP pages read (your KU efficiency number)
- Royalty per book in the series (book 1 versus book 2 versus book 3)
- Cost per acquisition from ads (your ROI on every channel)
How to actually track all seven in 2026
You cannot track every metric manually without losing two days a week to spreadsheets. The point of book biometrics is to automate the data collection so you can spend your time interpreting and acting, not collecting. A practical weekly workflow looks like this:
- Pull sales velocity and KENP from KDP reports (use the Bookreport browser extension to view this daily without logging into KDP)
- Pull BSR and category position from a tracker like K-lytics, Kindlepreneur, or directly from your Amazon product page
- Pull review counts from Amazon, Goodreads, Apple Books, and Kobo; track verified-purchase ratio
- Pull keyword rankings from Publisher Rocket weekly
- Calculate conversion rate from Amazon Ads dashboard if you run sponsored campaigns
- Calculate royalty per unit and per 1,000 KENP from your monthly KDP payout
- Log every number in one weekly biometrics sheet, color-coded green, yellow, or red by trend direction
The three vanity metrics most authors waste time on
Vanity metrics feel like progress but do not predict revenue. Three to stop obsessing over:
- Total Twitter or Instagram followers. Almost zero correlation with book sales unless your social audience is genre-specific and actively engaged with book content.
- Total Amazon reviews count. A 500-review book that earned its last review in 2022 ranks worse than a 90-review book earning two new reviews this week.
- Newsletter list size in raw subscribers. A 50,000-list with 2 percent open rate (1,000 actual readers) is worse than a 3,000-list with 35 percent open rate (1,050 actual readers).
How Read & Rate's book biometrics fits in
Read & Rate''s Book Biometrics tool consolidates the data points above into a single weekly dashboard so you stop bouncing between five tabs. The platform tracks verified reviews across multiple retailers (not just Amazon), monitors series read-through, surfaces velocity dips before they reach royalty deposits, and flags the keyword positions that are slipping. Pair it with our community-driven review service and you have both the diagnostic layer (what is happening) and the intervention layer (what to do about it).
- Cross-retailer review tracking (Amazon, Apple Books, Kobo, Goodreads, Barnes & Noble)
- Series read-through reports per book pairing
- Velocity and BSR trajectory alerts when metrics cross your thresholds
- Verified-purchase ratio monitoring (protects against Amazon review purges)
- Private reviewer comments that only you see, useful for early-warning craft feedback
The platform is designed to give authors the same kind of operational visibility a Fortune 500 marketing team has on its products, scaled down to the indie author workflow and price point. The goal is simple: turn data into decisions you can make in 45 minutes a week.
Frequently asked questions
How often should I check my book biometrics?
Weekly. Daily checking induces anxiety without adding signal because daily variance is mostly noise. Monthly checking lets problems compound for too long. A weekly 45-minute review hits the sweet spot: enough cadence to catch real shifts, infrequent enough to keep you focused on writing the next book.
What if I am not enrolled in Kindle Unlimited?
Five of the seven metrics still apply: sales velocity, BSR trajectory, review velocity, keyword visibility, and conversion rate. Skip the KENP-specific ones. If you are wide (not in KU), track sales velocity per retailer separately (Amazon, Apple Books, Kobo, Google Play) because each platform has its own algorithm and its own visibility signals.
Do these metrics work for nonfiction?
Yes, with two adjustments. Read-through benchmarks are lower (25 to 40 percent is healthy for nonfiction because readers extract value from key chapters and stop). Series read-through becomes "topic cluster read-through" or "evergreen catalog read-through": did the reader who bought your productivity book also buy your time-management book?
Should I track biometrics for free books or perma-free book 1s?
Yes, especially read-through. A perma-free book 1 has one job: convert readers into book 2 buyers. If 1,000 readers download book 1 and only 30 buy book 2, your perma-free funnel is broken at the book level, not the marketing level. Read-through for free book 1 should be at least three to five percent (which sounds low but matches industry benchmarks for free-to-paid conversion).
Sources and further reading
Primary sources for the data and benchmarks cited in this guide: Written Word Media indie author income reports (annual surveys of author earnings and KU page-read economics), Kindlepreneur (Dave Chesson''s research on the A9 algorithm and keyword tools), Amazon KDP royalty terms (the 70 percent versus 35 percent bracket rules), Authors Guild (traditional publishing contract data for the royalty comparison), and K-lytics (Kindle category data and BSR benchmarks).